02x06-silence_of_the_logs.kql
In this episode, Chris takes a look at Exchange-attribute Source of Authority (SOA) transfer - could this finally be the answer to removing that last Exchange server we’ve all been waiting for? And Koos has spent years deep in Microsoft Sentinel, and a big chunk of that has been log ingestion and keeping the ingestion bill under control: getting the right data in, keeping the noise out. He promised this wouldn’t turn into the Sentinel show, but when Microsoft ships two genuinely new log-ingestion features, he has to talk about them. There are two Azure Monitor previews worth talking about. The first, ‘multi-stage transformations’, lets you filter and aggregate logs before they’re ingested. The second brings platform logs into the Data Collection Rule model, the same way he already collects everything else. He’ll cover what’s genuinely new, and why he thinks Microsoft perhaps highlighted the wrong features in their blogs.
Exchange-attribute Source of Authority (SOA) transfer
For the longest time you still needed an on-premises Exchange Server to manage cloud recipient attributes, even after migrating all mailboxes to Exchange Online. These attributes were edited in your on-premises Active Directory and synchronized to Microsoft Entra ID through directory synchronization. This is sometimes referred as Last Exchange Server (LES). I’ve been talking about this since at least 2011 - how do you like the amazing color scheme in this slide template? What were we even thinking back then…
To edit these attributes, the only supported tools for those updates are the on-premises Exchange recipient cmdlets: Set-RemoteMailbox, Set-DistributionGroup, Set-MailContact, etc. Active Directory Users and Computers (ADUC), ADSI Edit, and third-party utilities aren’t supported for these attributes.
Needless to say, this requirement has been a headache for many organizations over the years. In April 2022 a workaround was released with Exchange Server 2019 Cumulative Update 12 called Exchange Management Tools (EMT). EMT lets administrators install only the Exchange management tools role on a domain-joined machine and manage recipients through PowerShell, without a running Exchange Server. EMT lets you shut down the server, but not uninstall it. The Exchange Active Directory configuration containers and security groups must stay in place for EMT to function. It removes the running-server burden but leaves Exchange-attribute SOA anchored on-premises.
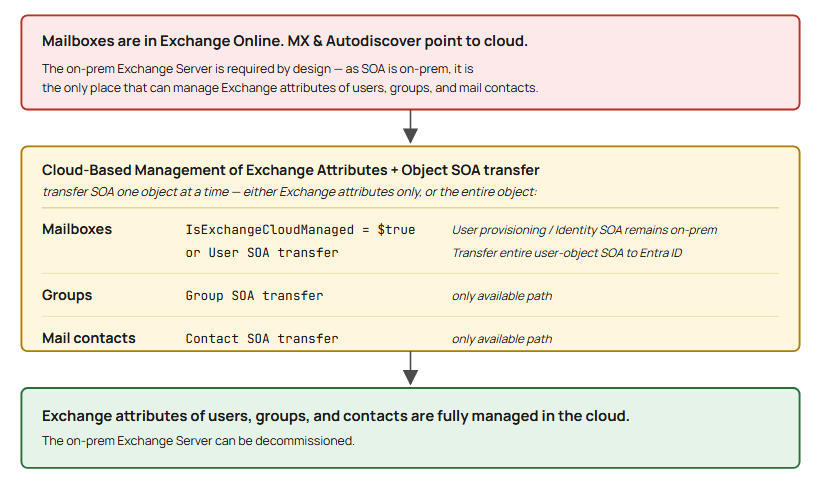
The good news is that administrators now have options to manage Exchange attributes for directory-synchronized users with mailboxes hosted in the cloud. There are two mechanisms to transfer SOA to the cloud:
- Cloud-based management of Exchange attributes: Set IsExchangeCloudManaged to
$trueon a directory-synchronized mailbox. The user object’s identity-attribute SOA stays on-premises and continues to synchronize from Active Directory to Microsoft Entra ID. Exchange-attribute SOA moves to Exchange Online, where the attributes become editable through Set-Mailbox. Phase 2 of this feature also provides writeback through Microsoft Entra Cloud Sync, which keeps the Active Directory copy current for any on-premises application that reads it. Available for mailboxes only. - Object Source of Authority transfer: Transfer the SOA of a directory-synchronized object to the cloud through the Microsoft Graph API. IsDirSynced flips to
Falsefor that object in Microsoft Entra ID. The user, group, or mail contact then behaves like a cloud-native object and is fully editable in the cloud. Available for users, groups, and mail contacts.
At a high level, the process to remove the last Exchange server looks like this:
Transferring Exchange SOA to the Cloud — Option Comparison
Two supported mechanisms move Source of Authority off the last Exchange Server so it can be decommissioned.
Option 1 — Cloud-based management of Exchange attributes (IsExchangeCloudManaged) |
Option 2 — Object Source of Authority (User SOA) transfer | |
|---|---|---|
| What moves | Exchange-attribute SOA only; identity attributes (name, UPN, manager, dept) stay mastered in on-prem AD | Entire object SOA — identity and Exchange attributes move to the cloud |
| Mechanism | Per-mailbox toggle: Set-Mailbox -IsExchangeCloudManaged $true (EXO PowerShell) |
IsDirSynced flipped to False via Microsoft Graph API |
| Object types supported | Mailboxes only — user, shared, device, room | User, group, and mail contact objects |
| Effect on dir sync | Object stays directory-synced; only Exchange attributes detach | Object becomes cloud-native; stops being AD-mastered entirely |
| Sync tooling required | Entra Connect Sync 2.5.76.0+. For Phase 2 writeback: Entra Cloud Sync + provisioning agent 1.1.1107.0+ (Active) | Modern Connect Sync baseline (same SOA-feature era) |
| Roles | Exchange RBAC — Exchange Administrator, Recipient Management, or Organization Management. (Some tenants still require elevated Entra role — Hybrid Identity Admin / Global Admin — depending on rollout) | Graph permissions to perform the SOA transfer |
| Timing / change control | After on-prem Set-RemoteMailbox edits, wait one full sync cycle + 24h before flipping |
N/A — single cutover per object |
| Writeback to on-prem AD | Phase 2 (public preview) writes selected attributes (proxyAddresses, extensionAttribute1–15) back via Entra Cloud Sync. Until then, on-prem AD copy goes stale | None needed — object is cloud-native after flip |
| Reversible | Yes — set $false to roll back (back up cloud-side changes first) |
Not cleanly reversible |
| Status | Phase 1 GA (Commercial/Global, GCCH, DoD, Gallatin); Phase 2 writeback in public preview | Available via Graph |
Something to consider
It’s worth noting that often on-premises Exchange servers are still used for other reasons, such as:
- Email relay for applications and multi-function devices
- Legacy public folders
- Journaling, compliance or data-residency requirements
These use-cases are still valid, if any of these apply to you and your environment, it may not be the right time for you to be looking at decommissioning that last Exchange server.
Links
Two useful new features for Azure Monitor
Quick confession before I start: you know me as “the Sentinel guy”. I’ve done a lot with log ingestion over the years, mostly the unglamorous part of keeping the cost down. I’ve seen enough Sentinel bills to have opinions there. Anyone who runs Sentinel at scale knows that bill is mostly about what you let in the front door.
And I promised myself this wouldn’t turn into the Sentinel show. But here’s my rule: whenever Microsoft ships something genuinely new in log ingestion, I get to talk about it. Across Build 2026 (June 2-3) and the week right after, they shipped two new things.
The problem we all live with
Logs in Azure are a firehose, and you pay by the litre (or 1/4th of a Gallon). 😉 Microsoft’s own number from the preview: “teams were ingesting 10 to 20 times more data than they actually queried.” I think that’s even much much lower in real-life. I’ve seen endless amounts of traffic logs stored. Why? “because compliance”. And if you’d ask which one? “All of them”. 🙄
Platform logs (Azure resource logs) are the other side of it. Every Azure resource can emit diagnostic data, and it’s all noisy. Historically you couldn’t shape it at all. It was often very ‘binary’ on most resources. On, or off.
And until now, your only real filter knob lived in the wrong place. A DCR supported exactly one KQL transformation step, and it ran on the ingestion side. So the data had already crossed the network and hit the Azure Monitor pipeline before you could drop anything. You saved on storage, but you’d already paid to ship it. At least for non-Sentinel-enabled Workspaces that is. Sentinel-workspaces got this feature for free, but the transformKql was still quite limited and not very friendly to update/maintain.
Multi-stage transformations (filter before it leaves the box)
Announced at Build 2026, public preview.
DCRs now support a ‘processor pipeline’. It’s an ordered chain of steps you compose like Lego, instead of cramming everything into one monster KQL query. The processors:
- Header: schematise raw data into rows (always first)
- Filter: drop records that don’t match a condition
- Parse: pull structured fields out of JSON, XML, or CEF payloads
- Map: rename, retype, or drop columns
- Aggregate: roll up high-frequency records into time windows
- KQL transform: arbitrary KQL (ingestion-side only)
Here’s what makes it genuinely new. Processors can run client-side, on the Azure Monitor Agent, before the data ever leaves the source machine. The records you drop never even leave the machine. You stop paying for them at the source, on both egress and ingestion.
Microsoft has published some numbers of how much you can save in that same blog. Bu anyone who’ve dealt with this know how noisy things can be.
- Syslog filter: keep only
SeverityNumber >= 4(Warning and up). 57,000 debug and info records an hour get dropped on the machine; 3,250 actually travel. (That’s the 94% in the title of the blog) - Perf counter aggregation: 500 VMs × 10 counters every 15 seconds is roughly 1.2M records an hour. Roll up to 5-minute windows on the agent and you’re at 60k. That’s 95% gone, and your dashboards that only need 5-minute granularity don’t notice a thing.
And there’s a clean ‘defender’ angle baked right in. Microsoft calls out compound filters as “especially useful for security teams that need specific event categories without paying for the full syslog firehose.” Their flagship example is a 4-step pipeline on the Windows Security log: header –> parse the XML –> filter to only logon success/failure (4624/4625) –> drop the bulky RawXml and RenderingInfo columns. You land a lean, security-focused table with exactly the events your detections query, and nothing else.
That’s detection-as-code thinking, but applied to the collection layer.
Platform logs join the DCR model
Public preview since June 10. Less flashy than the transforms, but it quietly changes how you collect platform logs.
I do think the blog leans hard on “no more manual setup” and I don’t think that’s the real story here. If your estate is big enough to feel this pain, you’re almost certainly already stamping out diagnostic settings with Azure Policy and DeployIfNotExists. So the setup-and-drift problem is solved already.
The real hook is what diagnostic settings could never do. You couldn’t shape the data; it was all-or-nothing per category. And you were stuck with shared keys for Storage and Event Hubs. DCRs fix both. You author one reusable rule. It can filter and transform at ingestion (Log Analytics destination), and it uses a managed identity instead. You still drive it all with Policy if you want, because DCR associations deploy that way too. So you keep the governance model you already have, and you gain a cost knob and a cleaner auth story on top.
What you get over diagnostic settings:
| Diagnostic settings today | Platform-log DCRs | |
|---|---|---|
| Config | A separate setting object on every resource | One reusable rule, associated to many |
| Cost / shaping | Already possible, but only via a separate workspace transformation DCR (per table, workspace-wide) | Same ingestion-time shaping, now defined in the rule and scoped to its resources (LA dest.) |
| Security | No modern identity pattern | Managed identity (system/user), least-priv RBAC, no shared keys |
| Ops/Governance | A separate per-resource mechanism (Policy/ARM can still deploy it) | Same declarative DCR model and tooling as the rest of Azure Monitor |
Destinations: Log Analytics, Storage, Event Hubs, and Partner Solutions. Preview scope is 22 resource types across 42 regions today. Microsoft will obviously be expanding this.
Two similar but different announcements
At first I was a bit confused by these announcements. Because if you’d only read the two blog headlines you might assume they’re the same trick, which they’re not.
The “94%-before-it-leaves-the-box magic” is an agent trick. It runs on the Azure Monitor Agent, on a VM. Platform logs are agentless. They’re emitted by the Azure resource provider itself, so there’s no agent to filter on.
Key takeaways
Two very useful features but I don’t think Microsoft emphasizes the proper benefits correctly in their blogs.
The 94% is a bit of a softball. “Keep Warning and above” is something you could already do at the agent, with the Syslog logLevels setting (and XPath selectors for Windows Events). So severity filtering isn’t the new trick. The genuinely new client-side powers are the things XPath and facility filters never gave you: parse a payload into typed columns, drop bulky columns like RawXml. XPath can only pick whole events, it can never trim fields.
Ingestion-side transforms aren’t new either. The ‘workspace transformation DCR’ and a single transformKql step in a DCR dataFlow have existed for ages. Both ran on the ingestion side, as a single KQL step in the cloud, after the data had already crossed the wire. The two new things are: a composable multi-processor chain instead of one KQL blob, and client-side execution on the agent. Microsoft even calls the new transform.KQL processor a “migration path from the legacy transformKql property.”
“Filter before ingestion” isn’t free for everyone. Only the agent client-side path is genuinely “never sent, never paid.” Ingestion-side filtering is the only option for agentless platform logs, and it reduces storage but it isn’t always free. For regular Log Analytics (without Sentinel), if you drop more than 50% of the data you get charged for the part above that 50%.
“Constant drift” is overstated if you already use Azure Policy. Plenty of customers already deploy diagnostic settings via Policy DeployIfNotExists, which already auto-remediates drift. The move towards DCR’s add the filtering, the one central reusable rule, and the managed identity. And DCR associations can still be deployed via Policy too.
Be VARY careful with the “Define-once-apply-everywhere” suggestion. The same ease that lets you enable platform logs across thousands of resources lets you balloon your ingestion across thousands of resources. And so will your monthly invoice. Select specific categories and scope your associations to only ingest what you actually use.
The AzureDiagnostics to ‘resource-specific’ transition is still in progress. Most services now write to resource-specific tables. Waaay better than the old AzureDiagnostics table. The Docs mentions “all Azure services will eventually…” but this was there already years ago. Some resources still write to AzureDiagnostics like API Management Services and Azure Firewall.
Take a look at your Diagnostic Logs and switch to resource-specific where you can. This enables you to apply filtering on specific resources and also leverage Sentinel data lake-only as a destination option.
A reminder with data lake: ‘mirroring’ copies tables into the data lake automatically, but you’ve still paid Analytics-tier ingestion first. ‘data-lake-only’ is the cheap path, with no Analytics tier. But you have to configure this very explicitly on a table:
Defender portal –> Microsoft Sentinel –> Configuration –> Tables –> Select applicable table –> Data Retention settings –> set tier to “Data lake tier”
Also remember the tradeoff: flipping a table to data-lake-only disables its Analytics-tier features. Alerting, analytics rules, custom detections, all gone for that table. Great for hunt and forensic noise, wrong for anything you need to actively alert on.
These are Public Preview features so you can get started right away. Check out the links in the shownotes on how to get started.
Links
- Is 94% of your syslog just noise? Now you can filter it out before ingestion (Azure Observability Blog)
- PUBLIC PREVIEW: Collect Azure Resource Platform Logs at Scale with DCRs (Azure Observability Blog)
- Platform log collection with data collection rules, Preview (Microsoft Learn)
- Platform logs supported resource types and regions, Preview (Microsoft Learn)
- Transformations in Azure Monitor, multi-stage preview (Microsoft Learn)
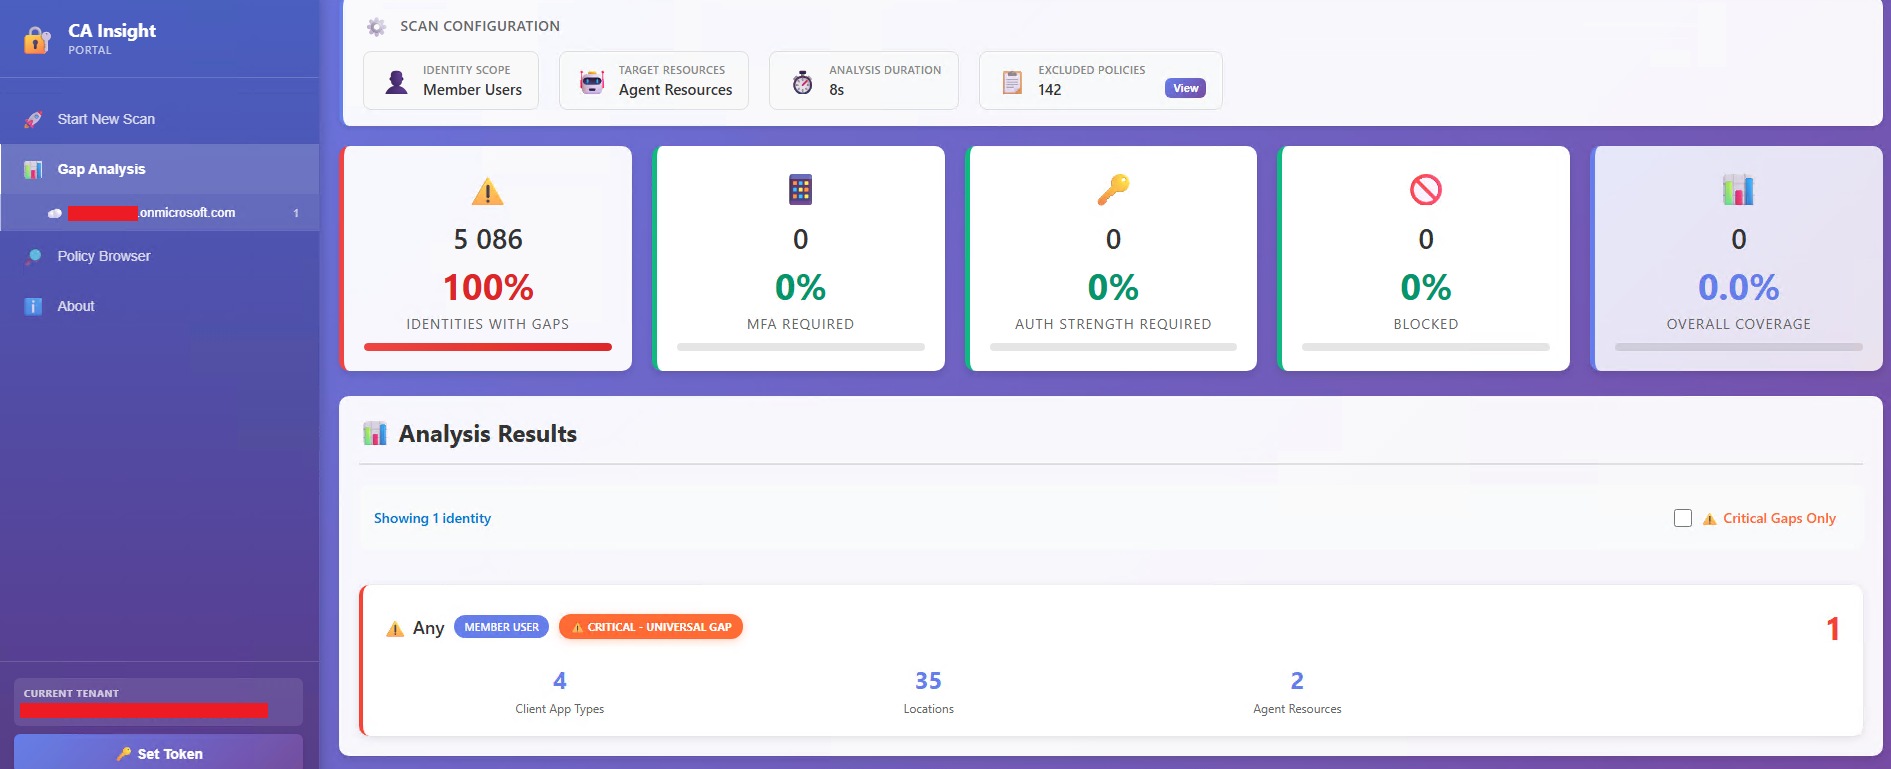
Community Project: CA Insight
CA Insight is a project by security researcher Emilien Socchi to help you discover gaps in Entra Conditional Access policies before attackers do.
Traditional gap detection relies on analyzing Entra sign-in logs to discover successful sign ins where no conditional access policy is applied. This approach has the disadvantage of being purely reactive because a gap is only discovered after it has already been used or exploited. In addition, unused gaps remain unknown because gaps that have not been (mis)used yet do not appear in sign-in logs and remain undiscovered. CA Insight takes an identity-centric approach to enumerate all possible access combinations, and evaluate each of them against the tenant’s Conditional Access policy configuration.
This approach comes with 2 main advantages:
- Purely proactive - All gaps are discovered before they are used or exploited.
- Minimal API interaction - Once policies and other necessary Entra objects have been retrieved from the MS Graph API, access combinations are generated and evaluated offline. This minimizes the amount of requests necessary for the analysis, and provides a scalable approach to analyze large tenants with thousands of identities.